Deep forecast evidence file
Which outer-London borough has the strongest house price growth by 2028?
Forecasting methodology reviewed by Oxford AI
This page documents exactly how we produced our outer-London borough forecast: the question we asked, the research process behind it, the borough-by-borough evidence, and every source used. Published July 15, 2026.
The forecast
Probability that each borough posts the strongest average house price growth (HM Land Registry / ONS UK House Price Index) from mid-2026 to mid-2028.
The top two carry most of the weight: Barking & Dagenham and Havering together hold 53% of the distribution, because this is a percentage-growth race and both pair a low base with a real in-window catalyst rather than a long-dated one.
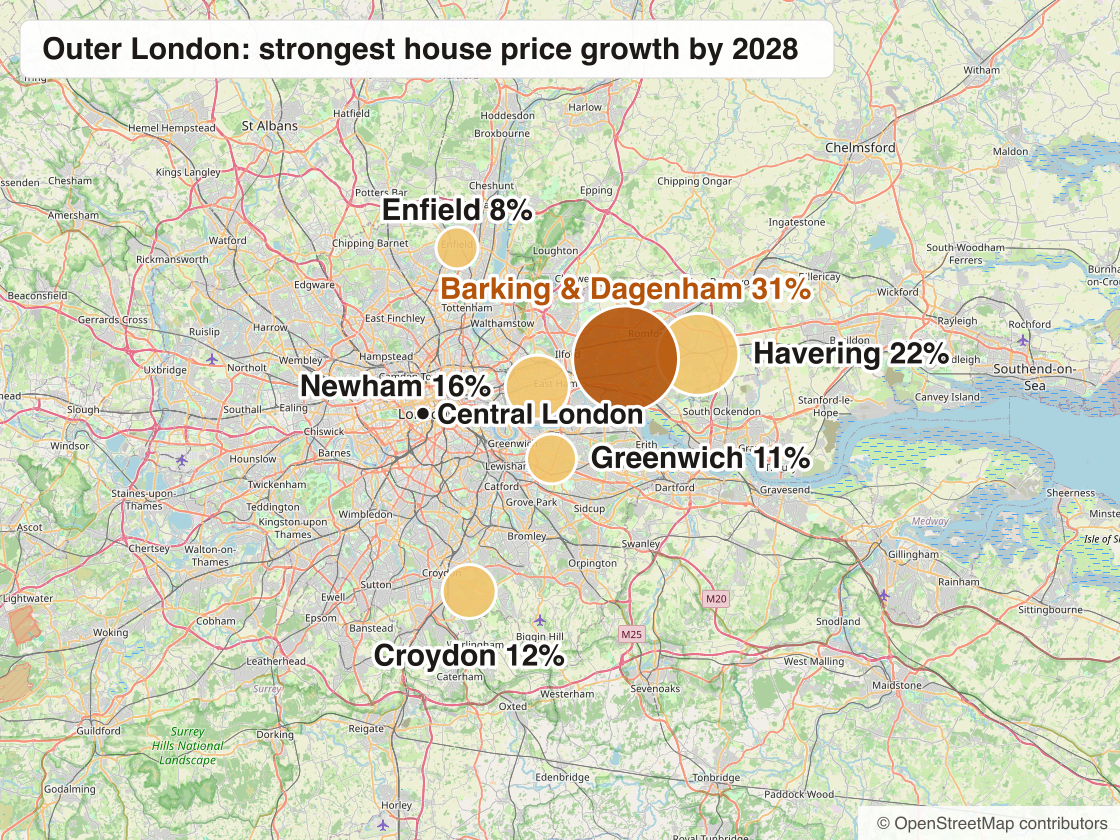
The same forecast on the map: marker size is the probability of posting the strongest house price growth by mid-2028, with the favourite in dark gold.
The exact question we asked
Question
Which outer-London borough will post the strongest average house price growth from mid-2026 to mid-2028: Barking & Dagenham, Croydon, Newham, Havering, Enfield, or Greenwich?
Resolution criteria
The winner is the borough with the highest percent change in average house price per the HM Land Registry / ONS UK House Price Index (all property types, London borough level) from June 2026 to June 2028. If the UK HPI is unavailable or revised for a borough, ONS median house price by borough (year to June) is the fallback.
Percentage-change math structurally favours cheaper boroughs, so the 2026 baselines matter: Barking & Dagenham ~£360K, Newham ~£395K, Croydon ~£395K, Greenwich ~£456K, Enfield ~£465K.
How the forecast was made
This forecast was produced with FutureSearch, a research-grade forecasting engine, run at its highest research effort level. It is not an opinion poll and not a single analyst's guess. The process works in four steps:
- Framing. We supplied the exact question, the six candidate boroughs, the resolution rule above, and the structural factors worth weighing. No market figures were asserted in the brief; the engine researched current values itself.
- Evidence gathering. The engine researched each borough independently: current price levels and momentum, affordability ratios, regeneration and delivery pipelines, transport catalysts, and policy.
- Probability assignment. Evidence for and against each borough was weighed into a probability distribution.
- Documentation. Every claim in the rationale carries a citation, reproduced in full below.
The macro backdrop the engine worked against: a moderate nominal-growth environment constrained by a 3.75% Bank Rate and elevated mortgage costs, with Savills having revised its UK house price forecast down as those costs weigh on demand. In that setting, structural advantages rather than broad market lift decide a percentage-growth race.
Borough-by-borough evidence
Barking & DagenhamThe cheapest base in the cohort, with a regeneration engine behind it31%
Barking & Dagenham is the strongest candidate because it combines the lowest average price of the six (about £360,000 as of April 2026) with genuine affordability: it is one of only two London local authorities with a price-to-earnings ratio under 10. On a percentage-growth measure, that low base is a structural advantage, since identical absolute gains produce larger percentage returns. Behind it sits the Barking Riverside regeneration, now consented to expand to as many as 20,000 homes alongside expanded transport infrastructure. What caps its probability near a third rather than higher: that same heavy new-build supply can dilute average resale growth inside the official index over a two-year window, and small-borough HPI is volatile.
HaveringThe most credible challenger: real momentum, less pipeline drag22%
Havering is the closest rival, and it is the only candidate carrying positive current momentum (+1.8% annual growth as of April 2026). It continues to harvest an Elizabeth Line dividend around Romford. Crucially, unlike the flat-heavy boroughs it competes with, Havering has strong demand for relatively affordable family-house stock (semi-detached +3.0%), and it suffers far less pipeline dilution than its East London neighbours. It trails Barking & Dagenham mainly on base price rather than on fundamentals.
NewhamThe strongest mean-reversion case, and the largest supply overhang16%
Newham is the sharpest two-sided bet of the six. It currently has the weakest momentum in the cohort (-3.2%), weighed down by the largest housing pipeline in London at 41,446 homes; that volume of flats and build-to-rent stock suppresses near-term appreciation. Against that, its low base (about £395,000) and the enduring value of Stratford, the Royal Docks vision, and Elizabeth Line connectivity make a sharp rebound entirely plausible. The probability reflects a real chance of recovery held back by visible oversupply.
CroydonCheap enough to compete, but the catalyst keeps slipping12%
Croydon shares a low base price with Newham (about £395,000), which gives it the same affordability maths in its favour, and it has shown pockets of terraced growth (+1.5%). Its ceiling is the catalyst: town-centre and Westfield regeneration has repeatedly stalled. A £1.2bn investment prospectus is in place, but major construction benefits look likely to land too late to move the borough index before mid-2028.
GreenwichGood fundamentals, wrong maths, heavy pipeline11%
Greenwich has excellent underlying fundamentals through Woolwich and Abbey Wood Elizabeth Line connections. It is held back on two fronts: a higher starting price (about £456,000) that drags on percentage-growth potential, and a large new-build pipeline of 28,755 homes creating an overhang. Good place, wrong contest.
EnfieldThe transformative project is real, but too back-loaded to count8%
Enfield is the most expensive of the six (about £465,000), which is the single biggest drag in a percentage-growth race. Meridian Water is a genuinely transformative 10,000-home project, but it is phased across roughly 20 years: too back-loaded to drive borough-wide index outperformance inside a mid-2026 to mid-2028 window. This is a long-horizon story competing in a short-horizon question.
The policy layer
Two policy forces pull in the same direction as the forecast. Current Stamp Duty Land Tax thresholds, with first-time buyer relief up to £500k, structurally favour owner-occupier demand in the cheaper boroughs: Barking & Dagenham, Croydon and Newham. Meanwhile the Renters' Rights Act regime implemented in May 2026, combined with elevated mortgage rates, is expected to drive some landlord sell-offs. That is a disproportionate downside risk for the flat-heavy, high-supply boroughs, Newham and Greenwich, which reinforces the tilt toward Barking & Dagenham and Havering.
What could change this forecast
Key uncertainties
- Barking & Dagenham's lead depends on new-build volume not diluting the average resale price inside the index. Heavy delivery is both its catalyst and its main risk.
- Newham is the widest distribution in the cohort: it is the worst performer today and the strongest mean-reversion case. A faster rate cut cycle would favour it and Croydon.
- Borough-level HPI is sensitive to transaction mix. A shift in the flats-versus-houses balance can move a borough's average price without underlying values changing.
- A sharper-than-expected landlord sell-off under the Renters' Rights regime could add stock and suppress prices in the flat-heavy boroughs faster than modelled.
This page is for informational purposes only and is not investment, financial, or property advice. Probabilities are estimates as of July 15, 2026 and are not guarantees of any outcome.
Pro & Premium
Unlock the full evidence file
The forecast map, town-by-town research trail, and every source behind this forecast are reserved for members with custom forecast tracking.
Custom forecast tracking from $19/mo/seat